
Please Note:
Accessing and using Google Maps data in this manner turned out to probably be against the Google Maps API EULA, Terms of Use etc – I’m leaving this information here merely for informational purposes only.
Google Maps is a great service to the world, don’t abuse their generosity in providing these APIs openly to us all unless you have confirmed permission to do so. There are other map services using similar APIs and I’m sure you can also use the fancy geographical calculations for something interesting. 🙂
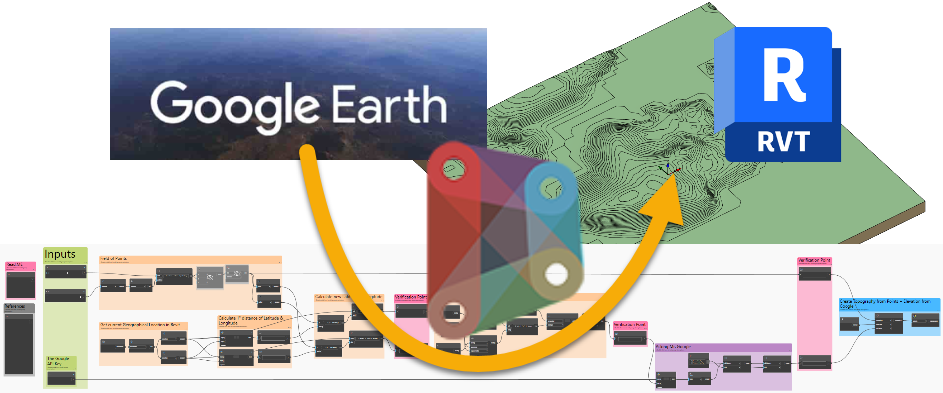
From the first time I saw Google Earth I was amazed by it – the way it lets me explore the entire world and even in 3D was just mind blowing and recently I learned that you can access the Google Earth data using one of all those APIs that Google makes available. For a charge I should add – but unlike the Swedish Land Survey (“Lantmäteriet”), Google apparently lets you play around with the API for free as long as you don’t cross some slightly mysterious boundaries. Hopefully I’ve stayed below that boundary during this little experiment or my Christmas shopping might suffer.
Since I’ve been playing around with APIs in Dynamo earlier I started wondering – would it be possible to use the Google APIs in Revit using Dynamo? Would I be able to bring some Google Maps data inside Revit and perhaps build my own little piece of Google Earth in Revit? And just how good is the data actually, can one use the elevation data for anything sensible?
The first step was setting up a Google Cloud account and activating the Elevation API on that account – there were some hoops to jump but eventually I got my very own API-Key to access the API. Using the API is quite straight forward and can be experimented with services such as Postman. Google has quite a good write-up here.
Then I wrote a small Dynamo script with just a Python node to access the API, using the same of code I’ve used before, just updated to CPython. It’s certainly not perfect but it works. I got some sample coordinates using a really great little page – latlong.net.
import urllib
from urllib.request import urlopen, Request
from urllib.parse import urlencode
url = "https://maps.googleapis.com/maps/api/elevation/json"
data = ""
status = ""
api_key = IN[0]
location = "59.326342,18.070441"
params = {"locations": location, "key": api_key}
url += "?" + urlencode(params, doseq=True, safe="/")
httprequest = Request(url, headers={"Accept": "application/json"})
with urlopen(httprequest) as response:
status = response.status
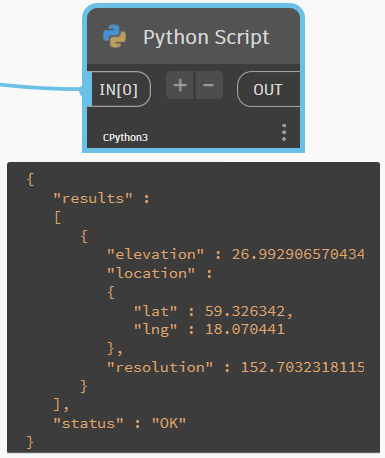
data += response.read().decode()
OUT = dataThis gave me a single .JSON result in Dynamo!
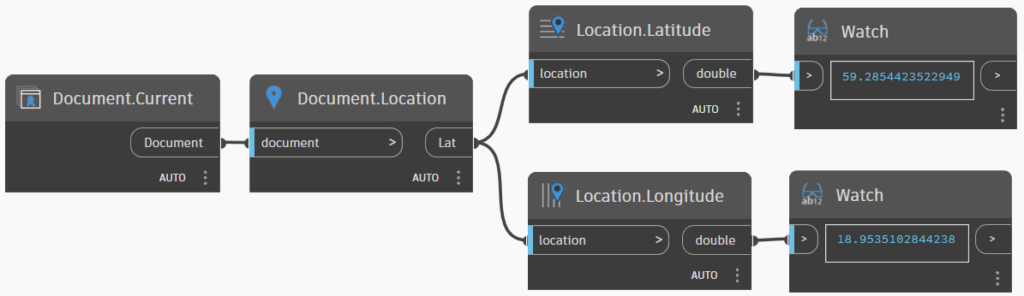
The Elevation API requires a Latitude and Longitude so I set those in Revit using Manage/Location and Dynamo actually has some really simple nodes for reading the geographical location. I could of course have read that using Python as well but since they are there, why not. Also I kind of like nodes.
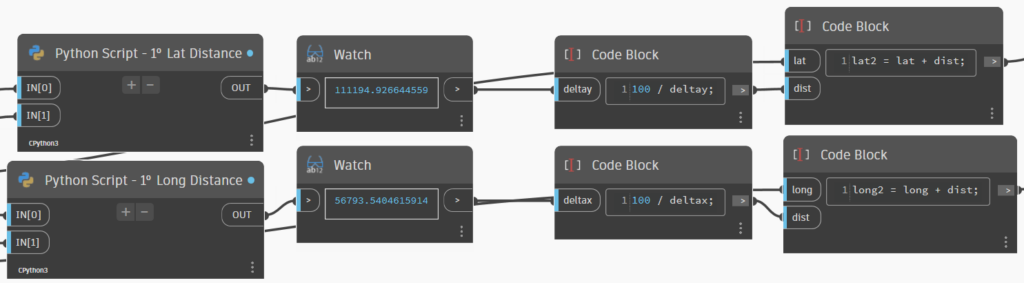
Reading one point of Elevation seemed to work just fine and I spent some time playing around in Dynamo Player reading elevations but realised that Latitude and Longitude are quite tricky things – if I wanted to create a Toposurface in Revit using those I kind of had to do some learning. I tried changing the numbers just slightly and ended up really far away. Googling taught me that between each degree of Latitude (from 59° to 60° for instance) the location shift about 111km to the north. And the same for Longitude. But that’s only valid at the equator, and I’m pretty far north of the equator – over here one degree of Longitude seemed to be about 56km. Strange. Unless you know that earth is not flat. Or round. It’s a bit of a fatty planet and the Longitude distance will of course vary.
So I needed to do some maths. But did googling instead and found a great formula for calculating the distance between two locations – with the only complication that the formula was in Javascript so it would need to be slightly altered to work in CPython….
Haversine
 formula:	a = sin²(Δφ/2) + cos φ1 ⋅ cos φ2 ⋅ sin²(Δλ/2)
c = 2 ⋅ atan2( √a, √(1−a) )
d = R ⋅ c
where	φ is latitude, λ is longitude, R is earth’s radius (mean radius = 6,371km);
note that angles need to be in radians to pass to trig functions!
JavaScript:
const R = 6371e3; // metres
const φ1 = lat1 * Math.PI/180; // φ, λ in radians
const φ2 = lat2 * Math.PI/180;
const Δφ = (lat2-lat1) * Math.PI/180;
const Δλ = (lon2-lon1) * Math.PI/180;
const a = Math.sin(Δφ/2) * Math.sin(Δφ/2) +
          Math.cos(φ1) * Math.cos(φ2) *
          Math.sin(Δλ/2) * Math.sin(Δλ/2);
const c = 2 * Math.atan2(Math.sqrt(a), Math.sqrt(1-a));
const d = R * c; // in metres
Then I thought of the great solution to simply calculate one degree of difference in both directions and then divide the distance I wanted to travel by that distance. If I wanted to travel 111km it would be 1 and if I wanted to travel 100m it would be tiny, really tiny. And then just adding that tiny difference to my original location. I’ve probably made some mistake in that assumption (it seems too simple) but it did work, I was able to create new locations in specific distances from my original location…..
Now the only thing needed was some basic, standard, Dynamo nodes – creating some points to feed my new friend Google, and building a topography. The Y coordinate of my points was Latitude and the X Longitude….
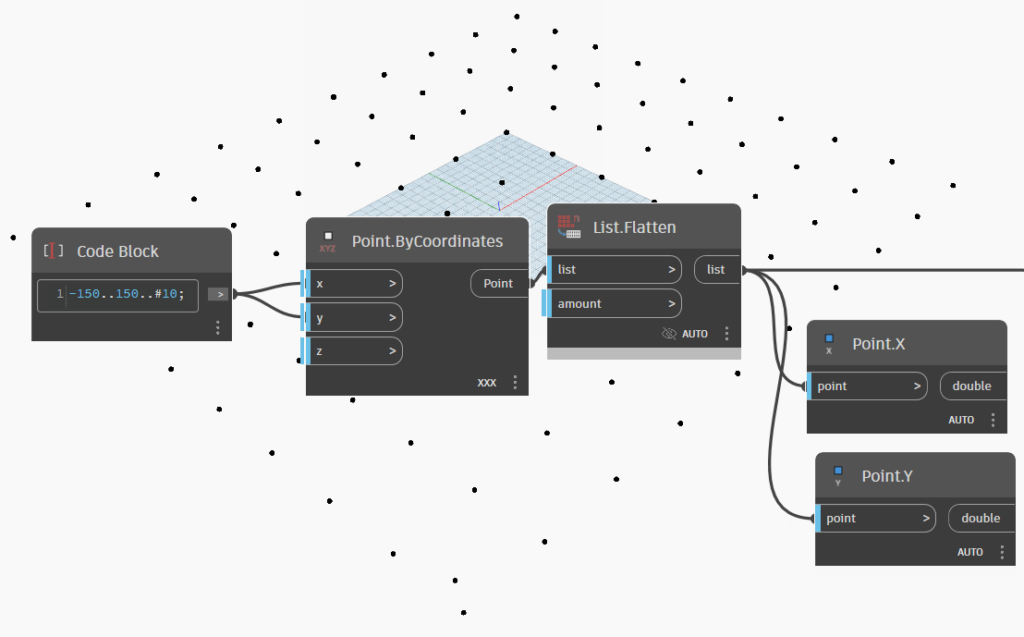
Google expected them to be written with dots instead of commas and multiple points needed to be separated by a | character. Some small string manipulation acrobatics and Google provided a .JSON-result for all my points!
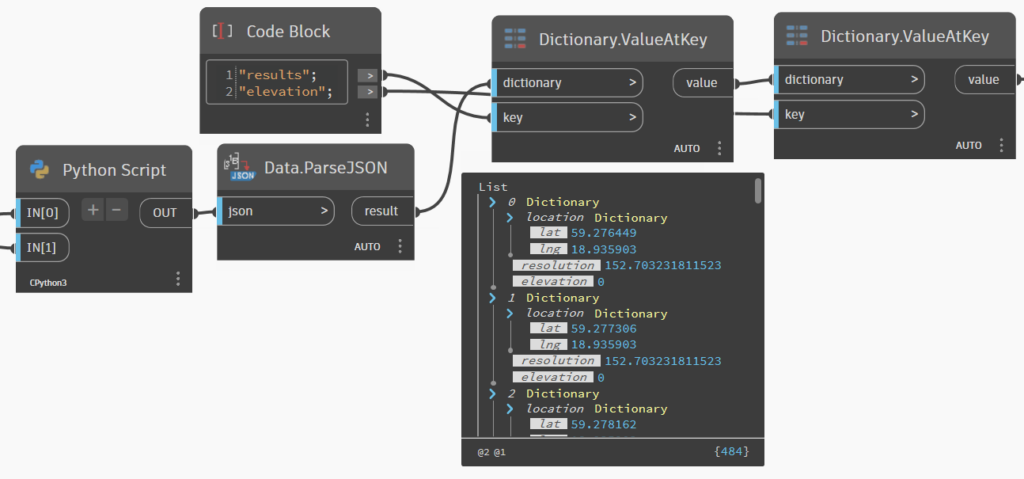
The .JSON was really simple to process and then I had the elevations and after that it was only a question of translating my measurement points vertically and create a topography using standard nodes. All done, like magic!
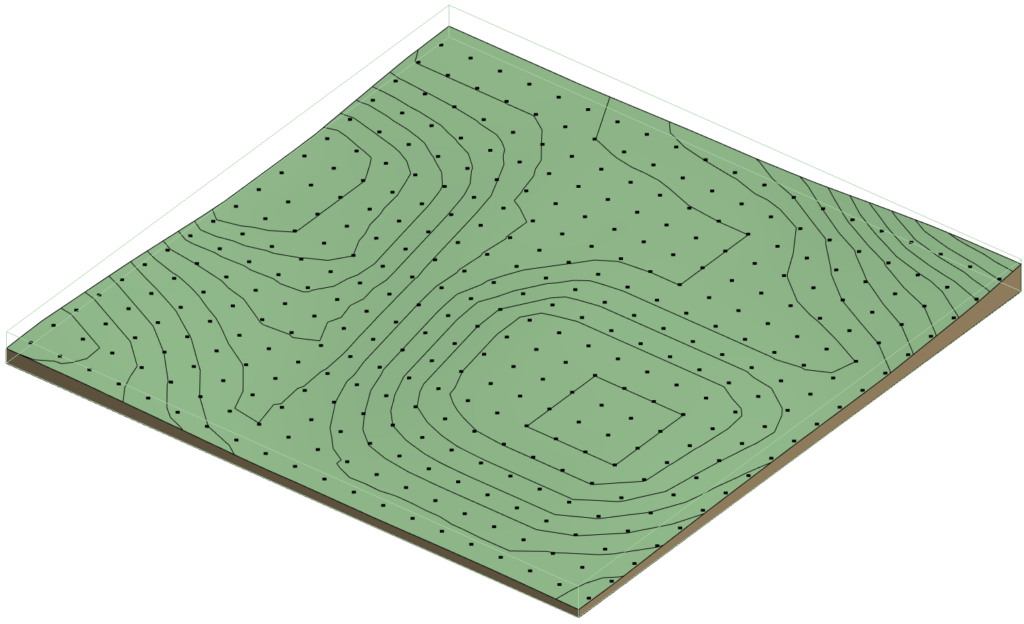
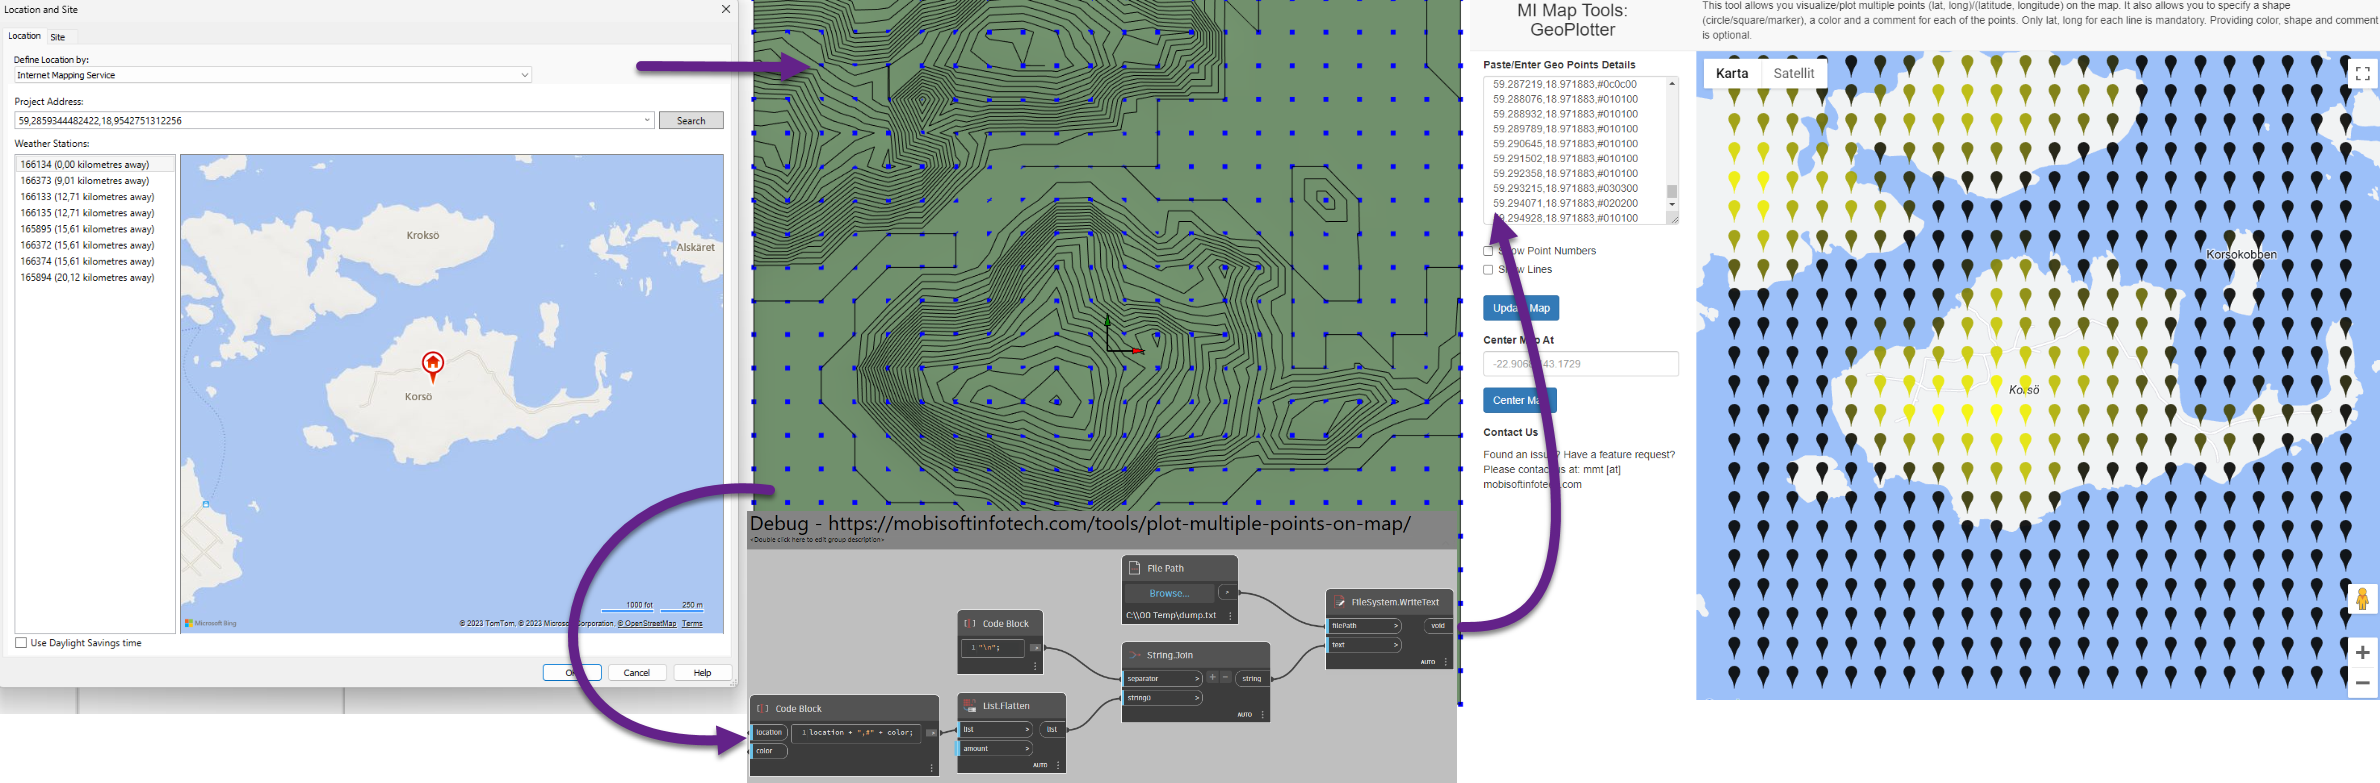
The only thing left was to spend quite a long time suspecting I made some kind of horrible mistake and I did some debugging using Notepad and another great web page I found – where you can simply copy and paste coordinates into a Google map! Here is a 2km² grid of points from the Revit location of the island Korsö into a toposurface and then also copy/pasted on MI Map Tools’ GeoPlotter:
The final Script:
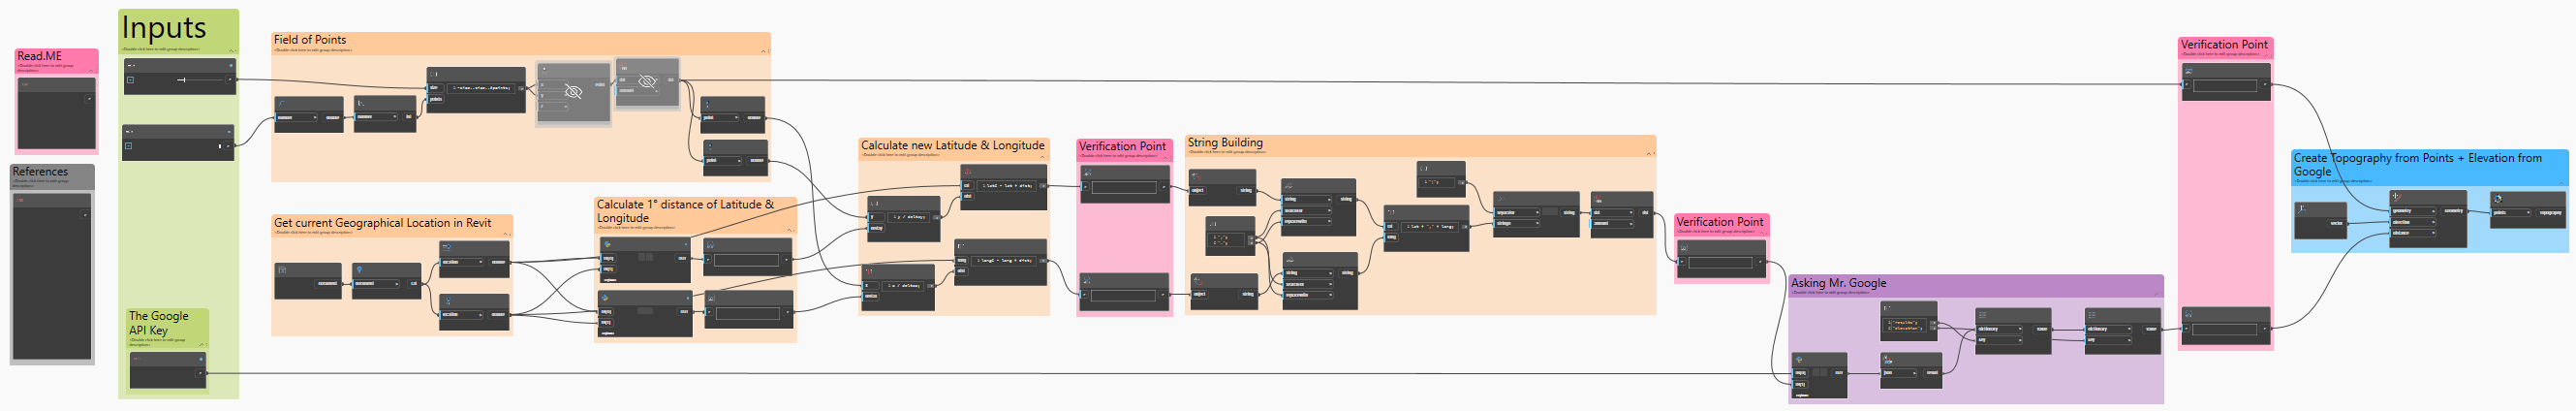
If you would like the script itself – it’s right here….
Some stuff I noticed
- You can only send 500 points at a time to the Elevation API – if you want to send more you’ll need to do some list chopping and Python work.
- The accuracy is not that good – at least not for the areas in Stockholm that I’ve compared to the Land Survey data, sometimes the difference might be as much as 8-10m!
- According to the interwebs, the accuracy improves if you query fewer points but I can’t say that I noticed that. I get the same Elevation for one as for 500 points.
- I’m not quite sure about Dynamo’s ability to work with such precise numbers required for this little experiment – that might explain the above. Or not.
- I still get Latitude and Longitude mixed up (the same with X and Y) and have probably done that somewhere on this page already…